
Progress Report Dashboard
Welcome to the latest edition of Raise DC’s Progress Report!
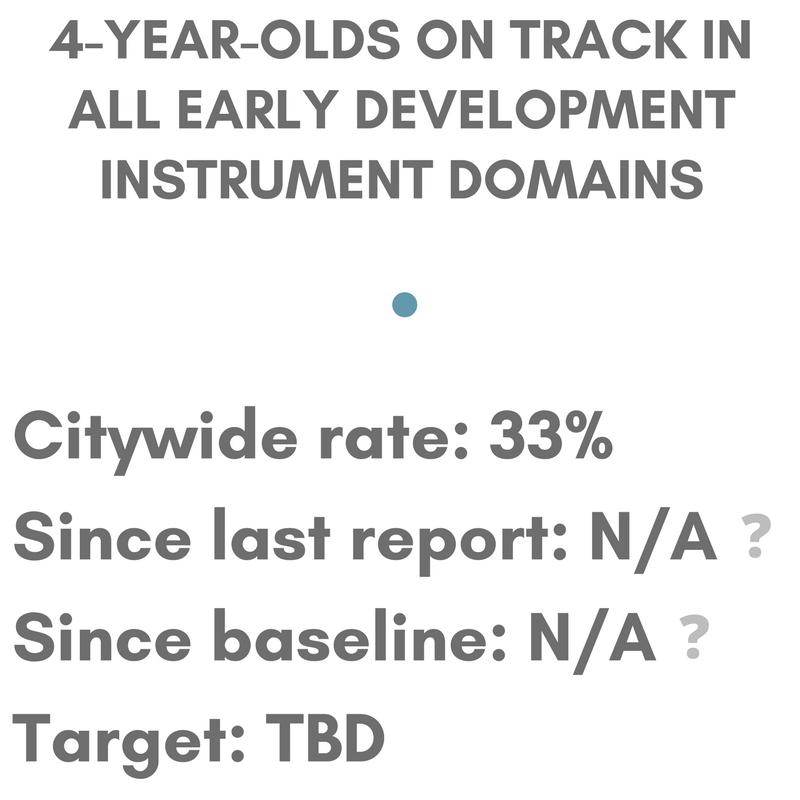
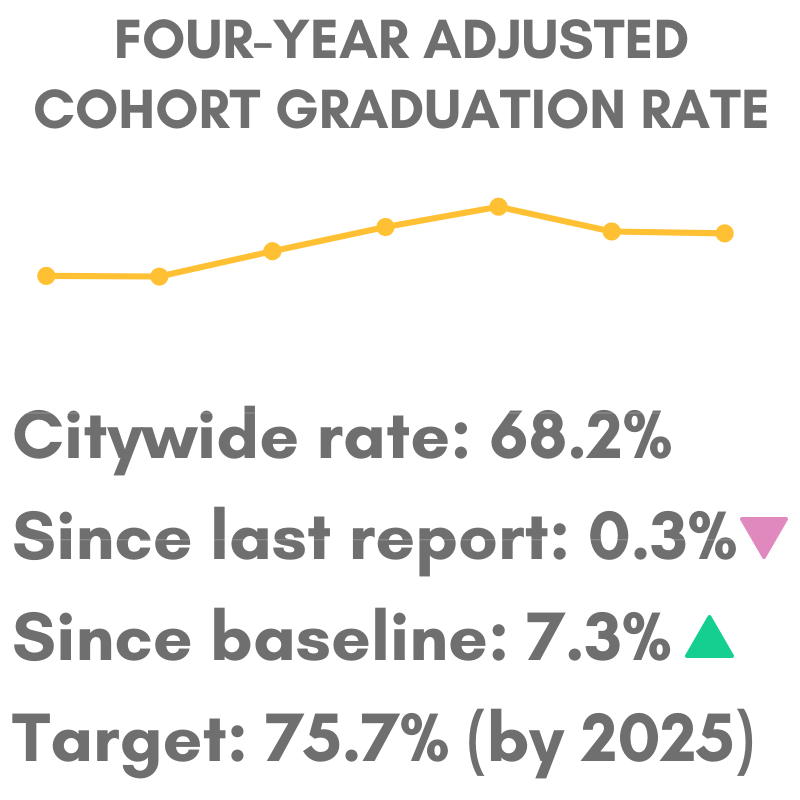
Here, you will find the data we track to determine progress on our five high-level, citywide goals.
Click on the “Kindergarten Readiness” and “High School Graduation” icons below for our first two installments of data.


INDICATORS
WHAT IS AN INDICATOR?
Indicators tell us if we are making progress toward each goal. We examine several key indicators to assess whether our efforts directly or indirectly advance each goal in the near term, mid-term, or long term.
Core Indicator: Core indicators serve as the primary measures for each of Raise DC’s five, citywide goals. They quantify the long-term results we expect to achieve that are at the “core” of our collective work.
Contributing Indicator: Contributing indicators are intermediate measures that tell us if a set of strategies or initiatives that “contribute” to a core indicator is working. They often reflect mid-term results we expect to see.
To learn more about any of the indicators listed throughout each goal area page, visit our Data Dictionary.
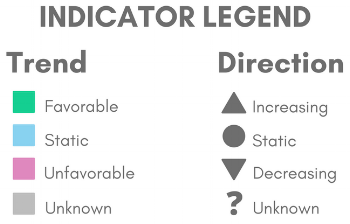
We also track the direction in which these indicators are trending, as well as change since our last Progress Report (released September 2015) and since our baseline Report Card (released February 2013). The following symbols are used to provide a quick, visual explanation:
WHY ARE WE RELEASING DATA ONE GOAL AT A TIME?
As part of our commitment to making data actionable, we want to ensure its timely public release to external stakeholders. In the past, our data reports have compiled indicators from across the cradle-to-career continuum in one annual or bi-annual release, but by this point, some data points were already outdated.
Therefore, we are releasing new citywide and Change Network-focused data one goal area at a time. Over the course of the next year, each of our high-level goals above will be populated with updated numbers, change over time, and information about our focused progress.
The data you’ll find within contains visualizations created in Tableau. To better understand definitions, calculations, and sources of the original data, visit our Data Dictionary or click on links below each data point.
If you have any questions about Raise DC’s Progress Report or the data within, reach out below.